Comparing countries through data viz.
2019 | Knowledge hub
Information is Beautiful, in partnership with The World Government Summit, put out a call for designing data on good governance. From the range of supplied data, the ask was to “creatively visualize new perspectives and stories.”
Info and Such responded to the callout with an interface that allows to compare world countries along different markers with visualizations correlating data on freedom, perceived happiness and sustainable development.
This project was longlisted for the Information is Beautiful Data Visualization Prize.
The project in brief
The need
A carte blanche with the simple ask of visualizing new perspectives.
The solution
The world visualized —correlating happiness, freedom and sustainable development.
The services
Data Visualization, UX/UI.
The outcome
An interface to easily browse, explore and compare all visualized countries.
The project
Compiling multiple data sets in a simple shape
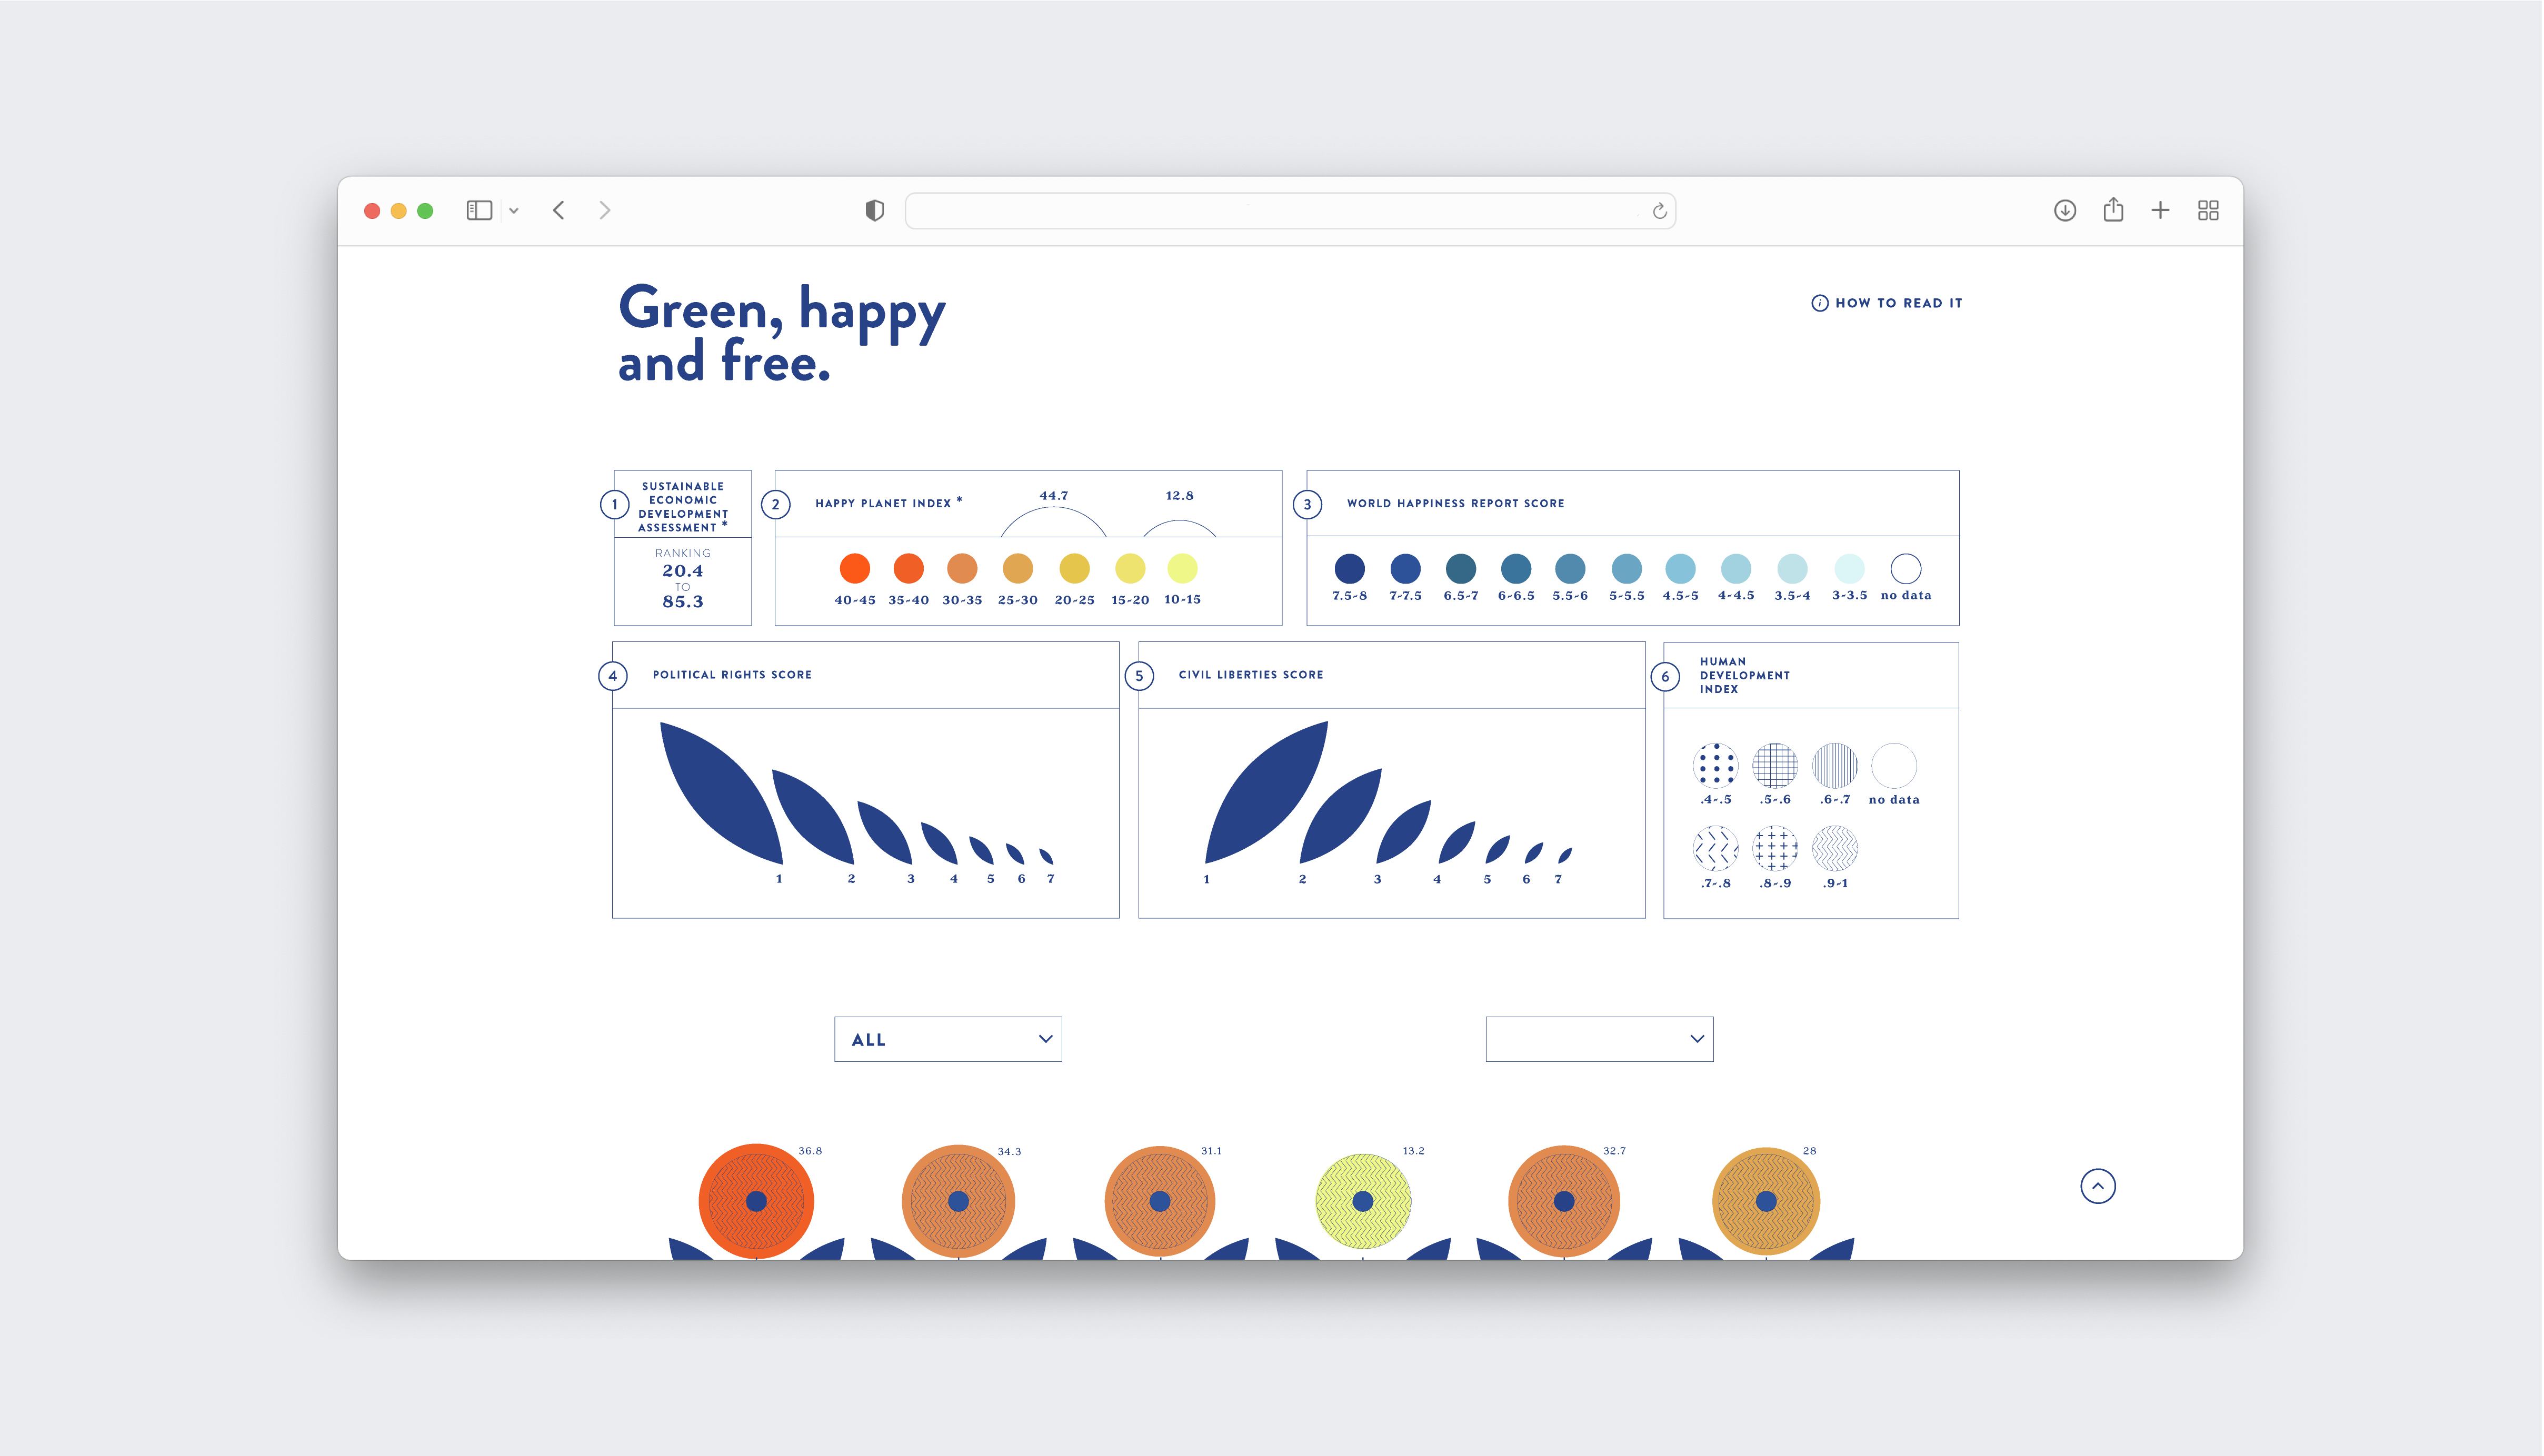
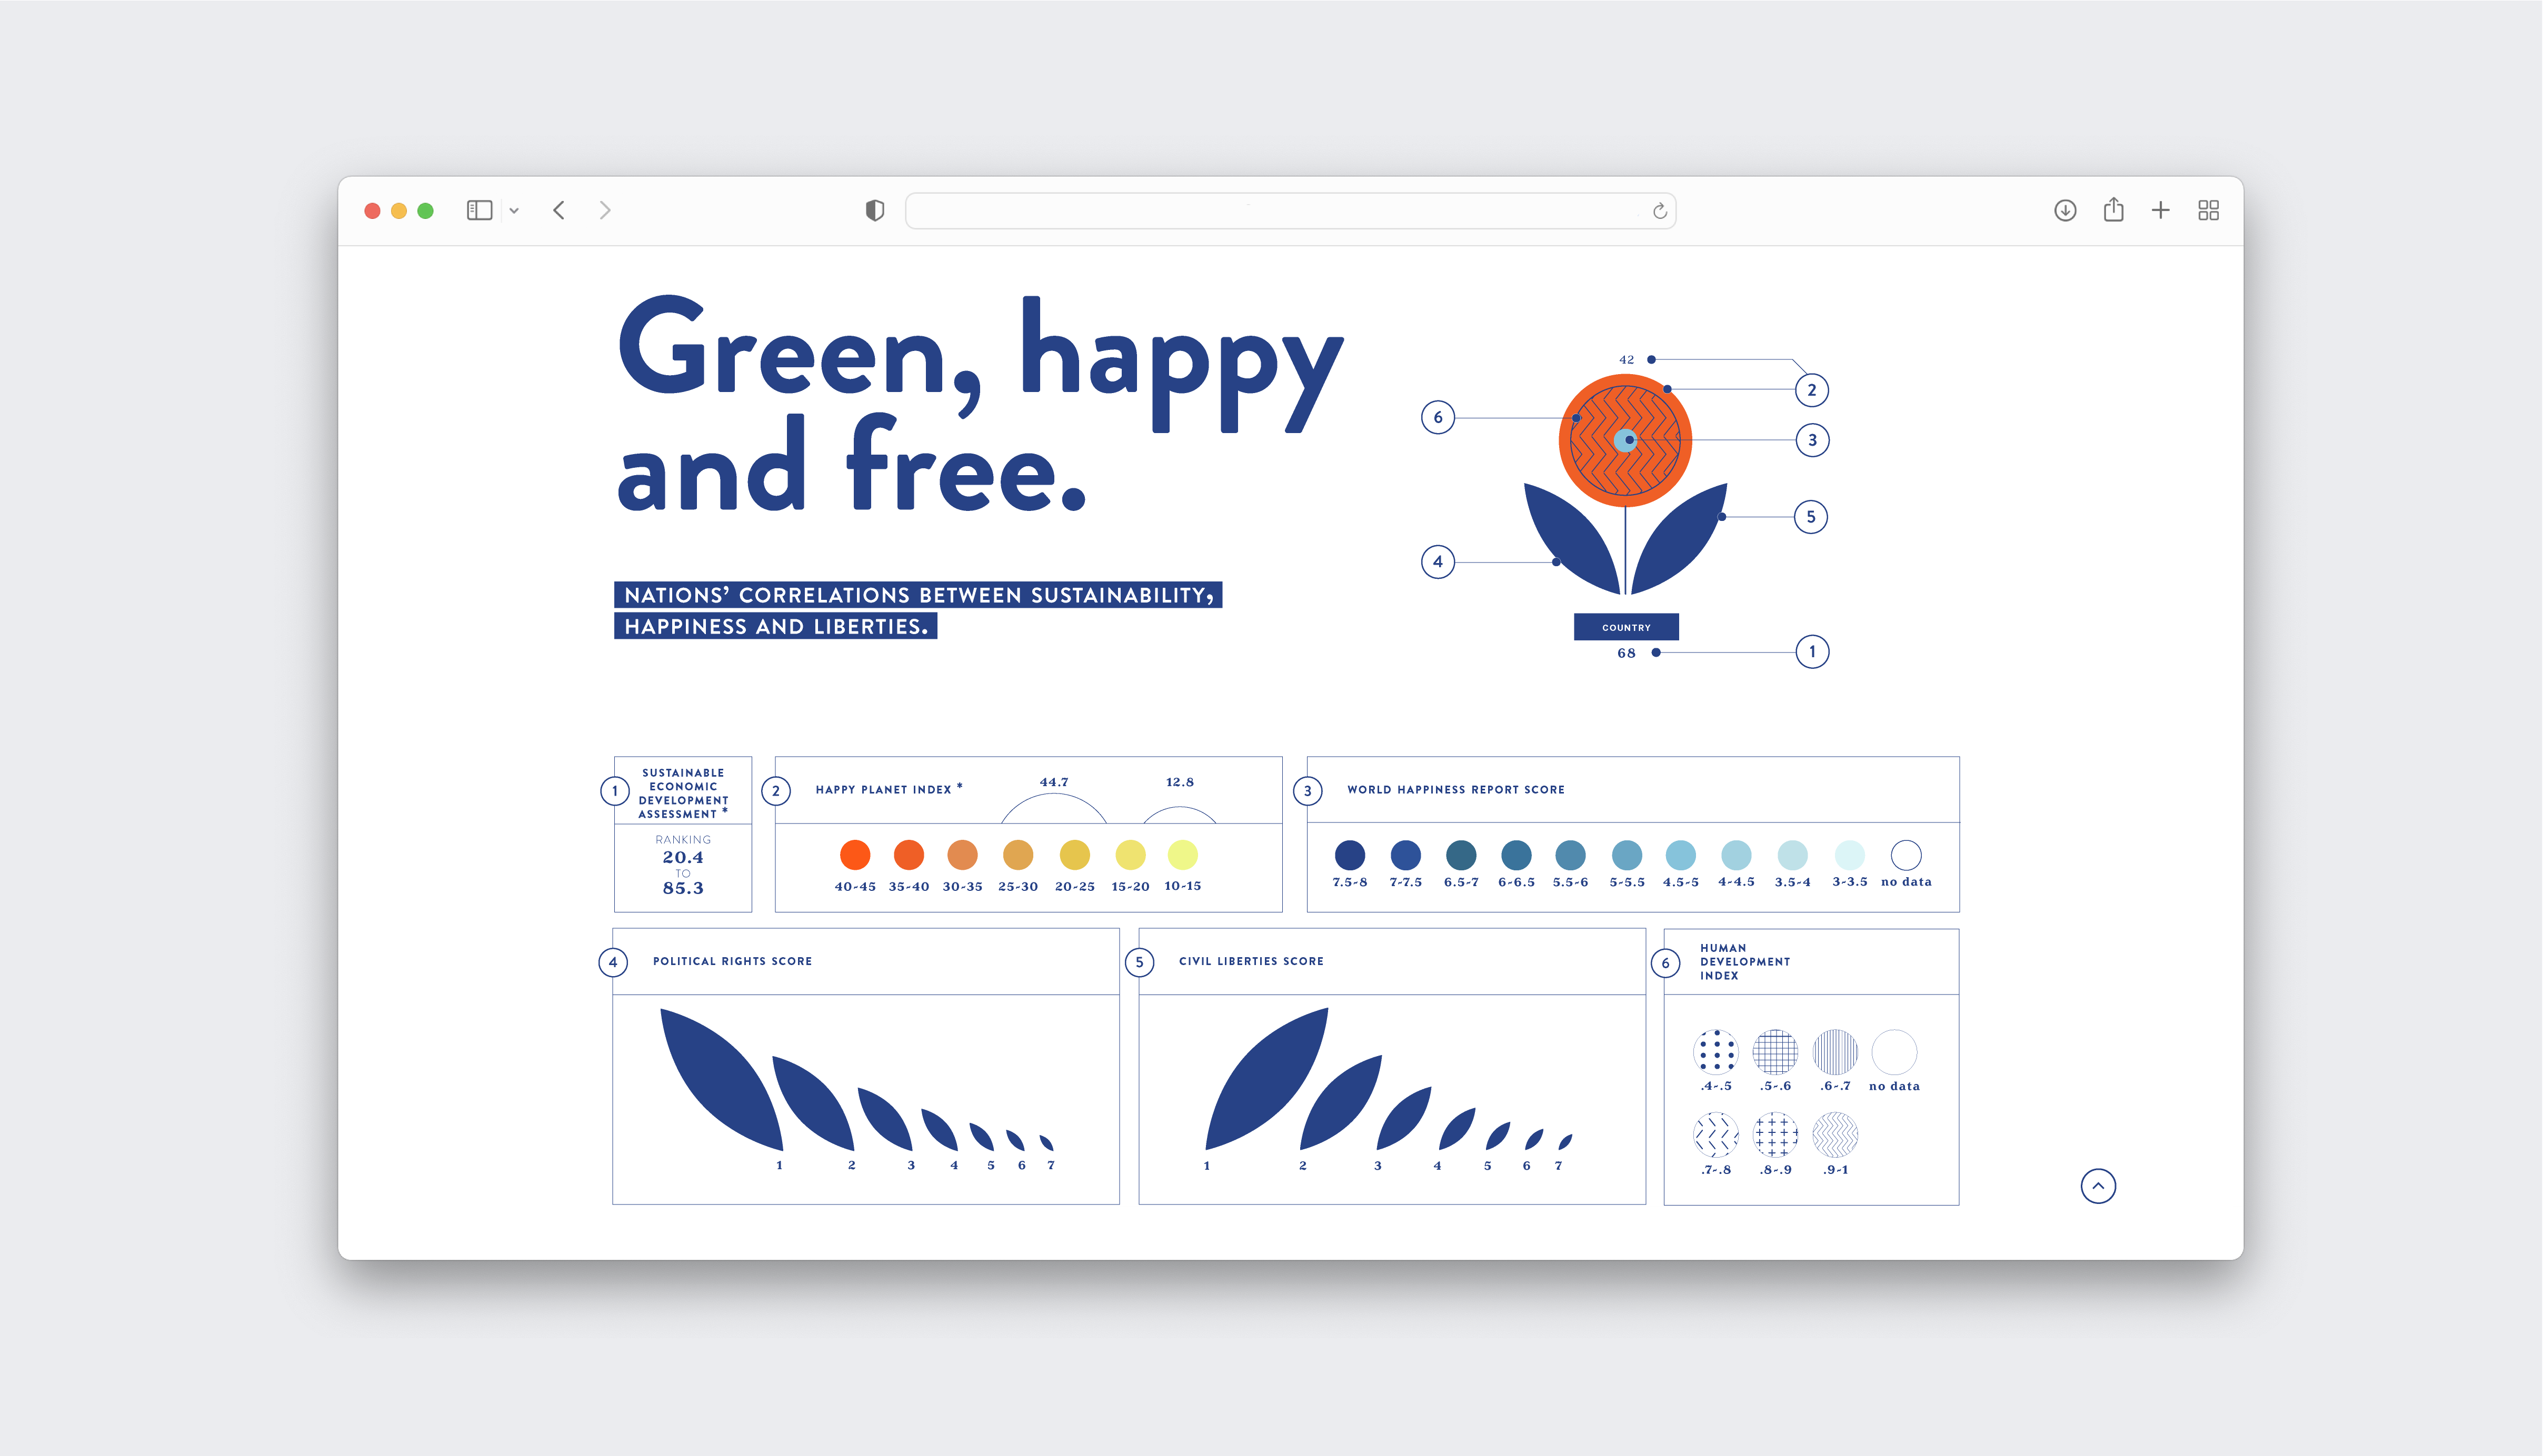
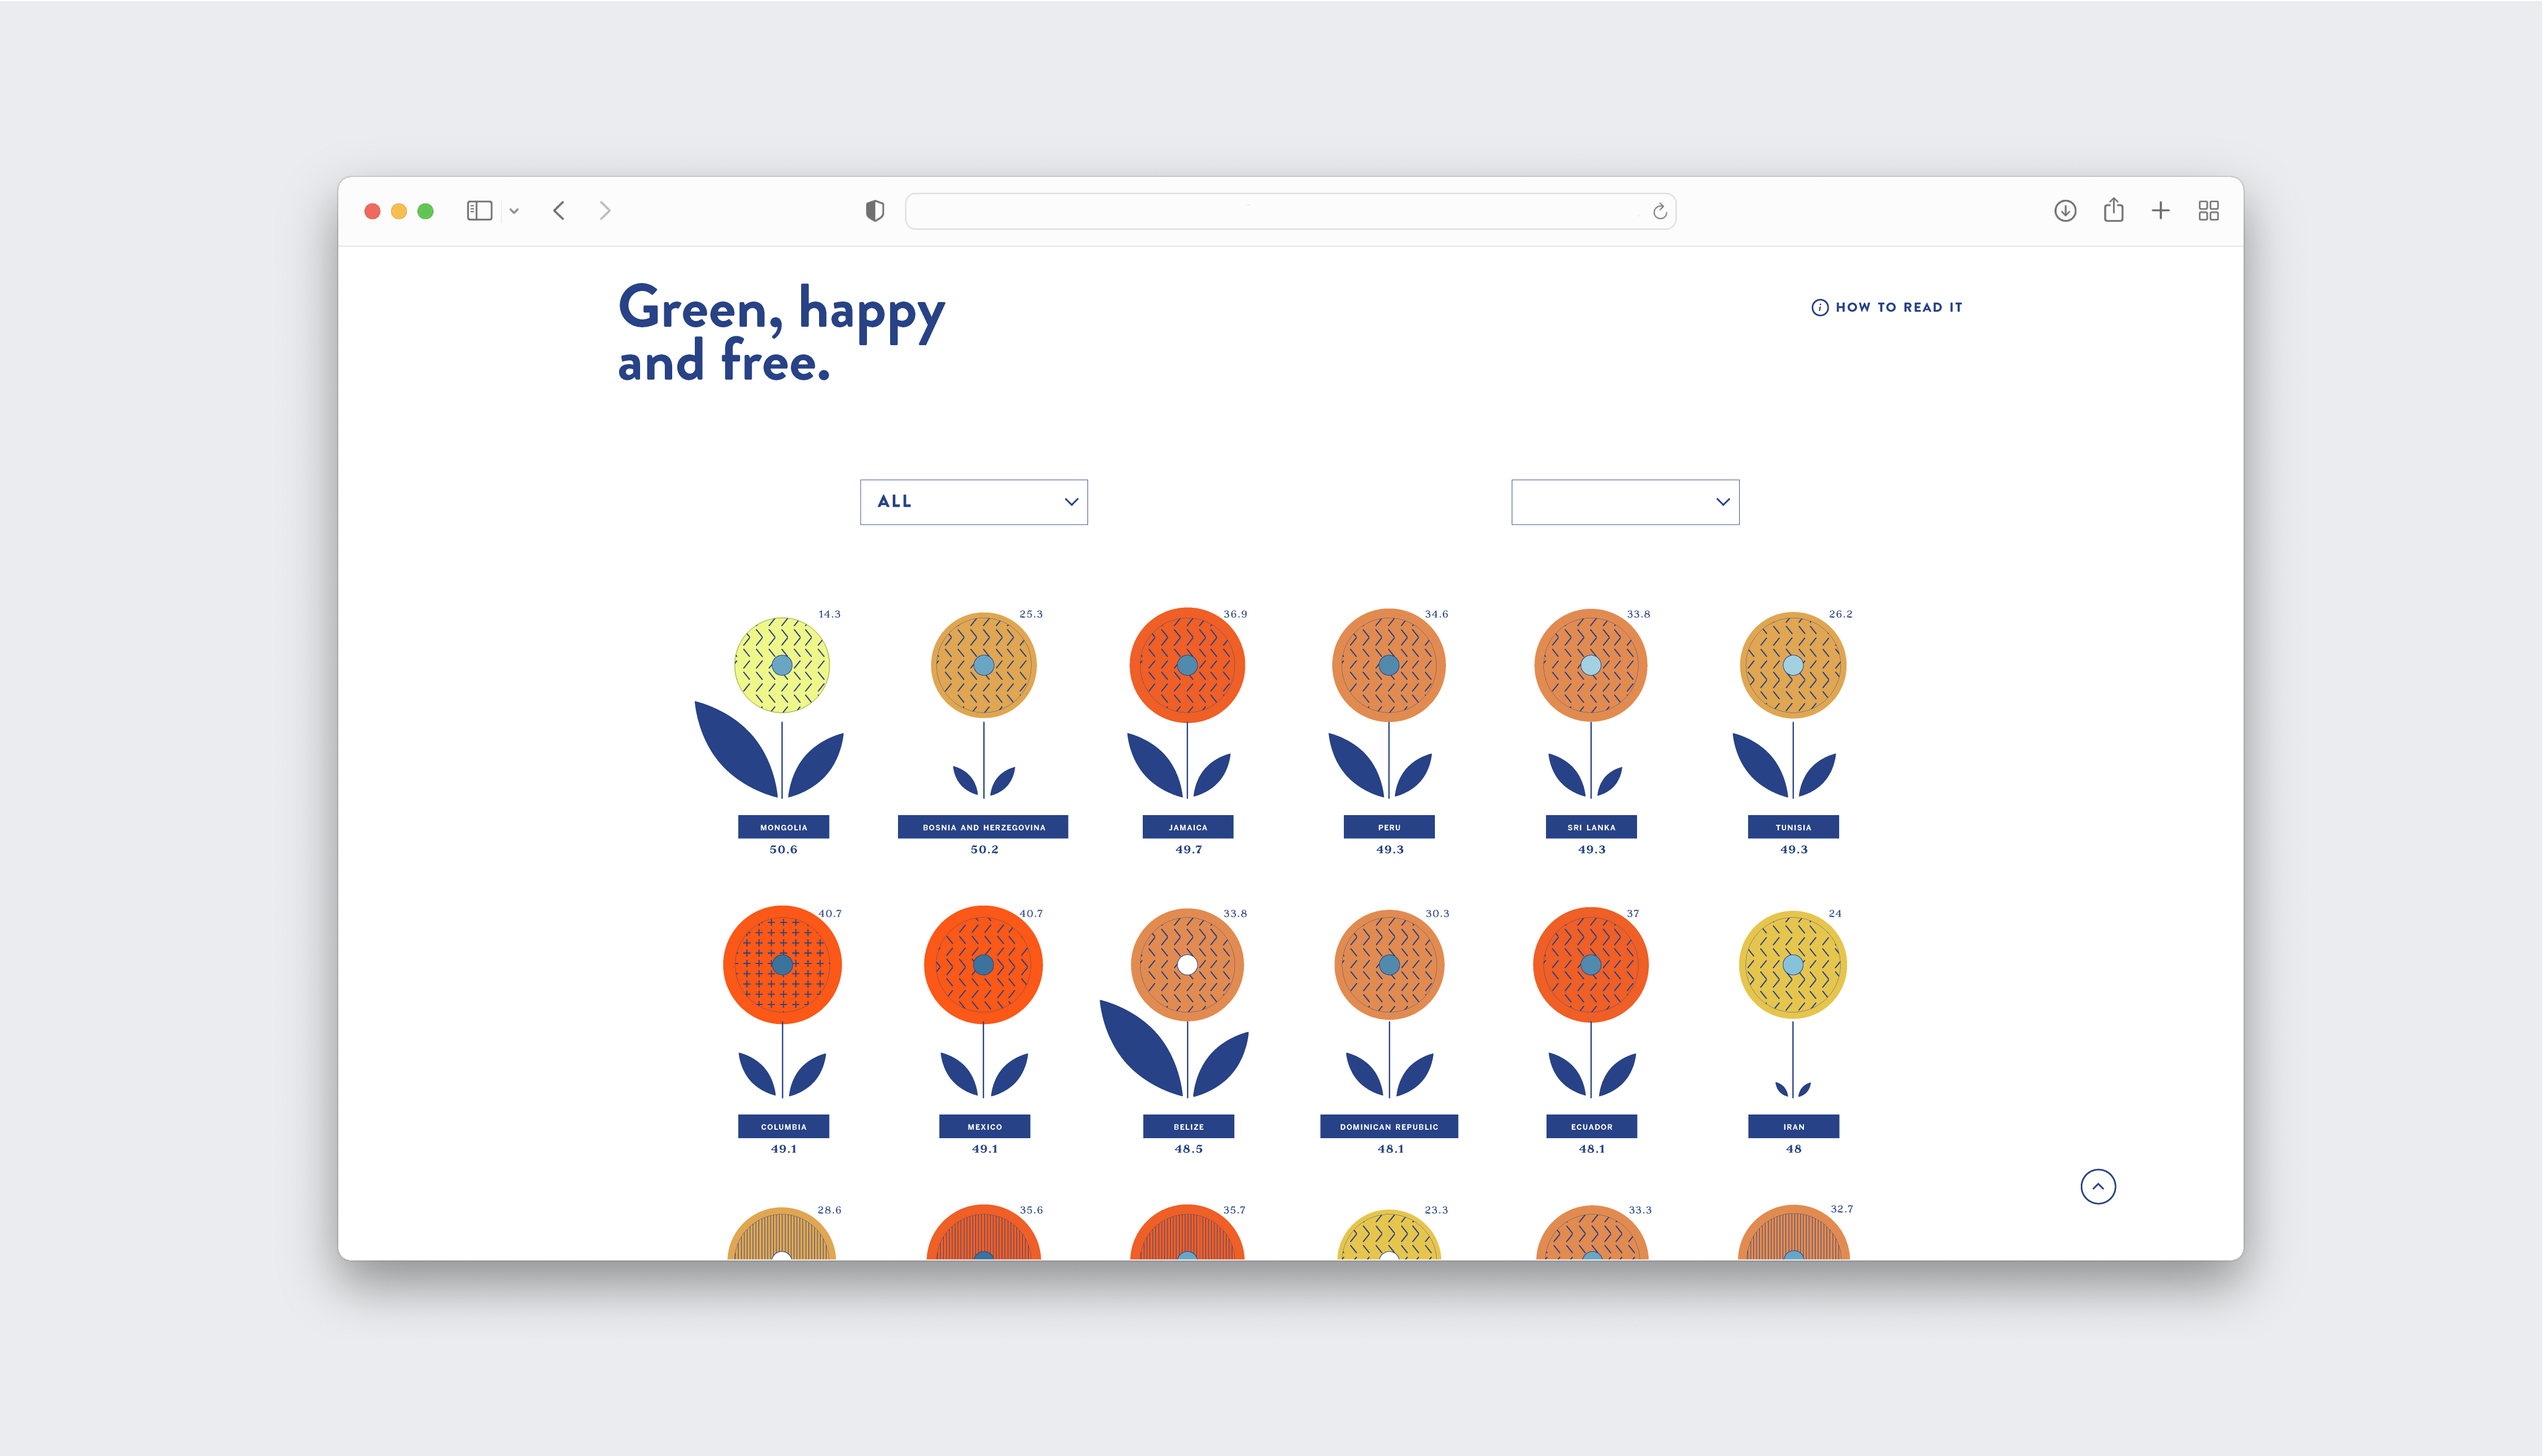
Green, Happy and Free represents the correlation between sustainability, happiness and liberties for each of the world’s country. The three themes are expressed through six different data sets.
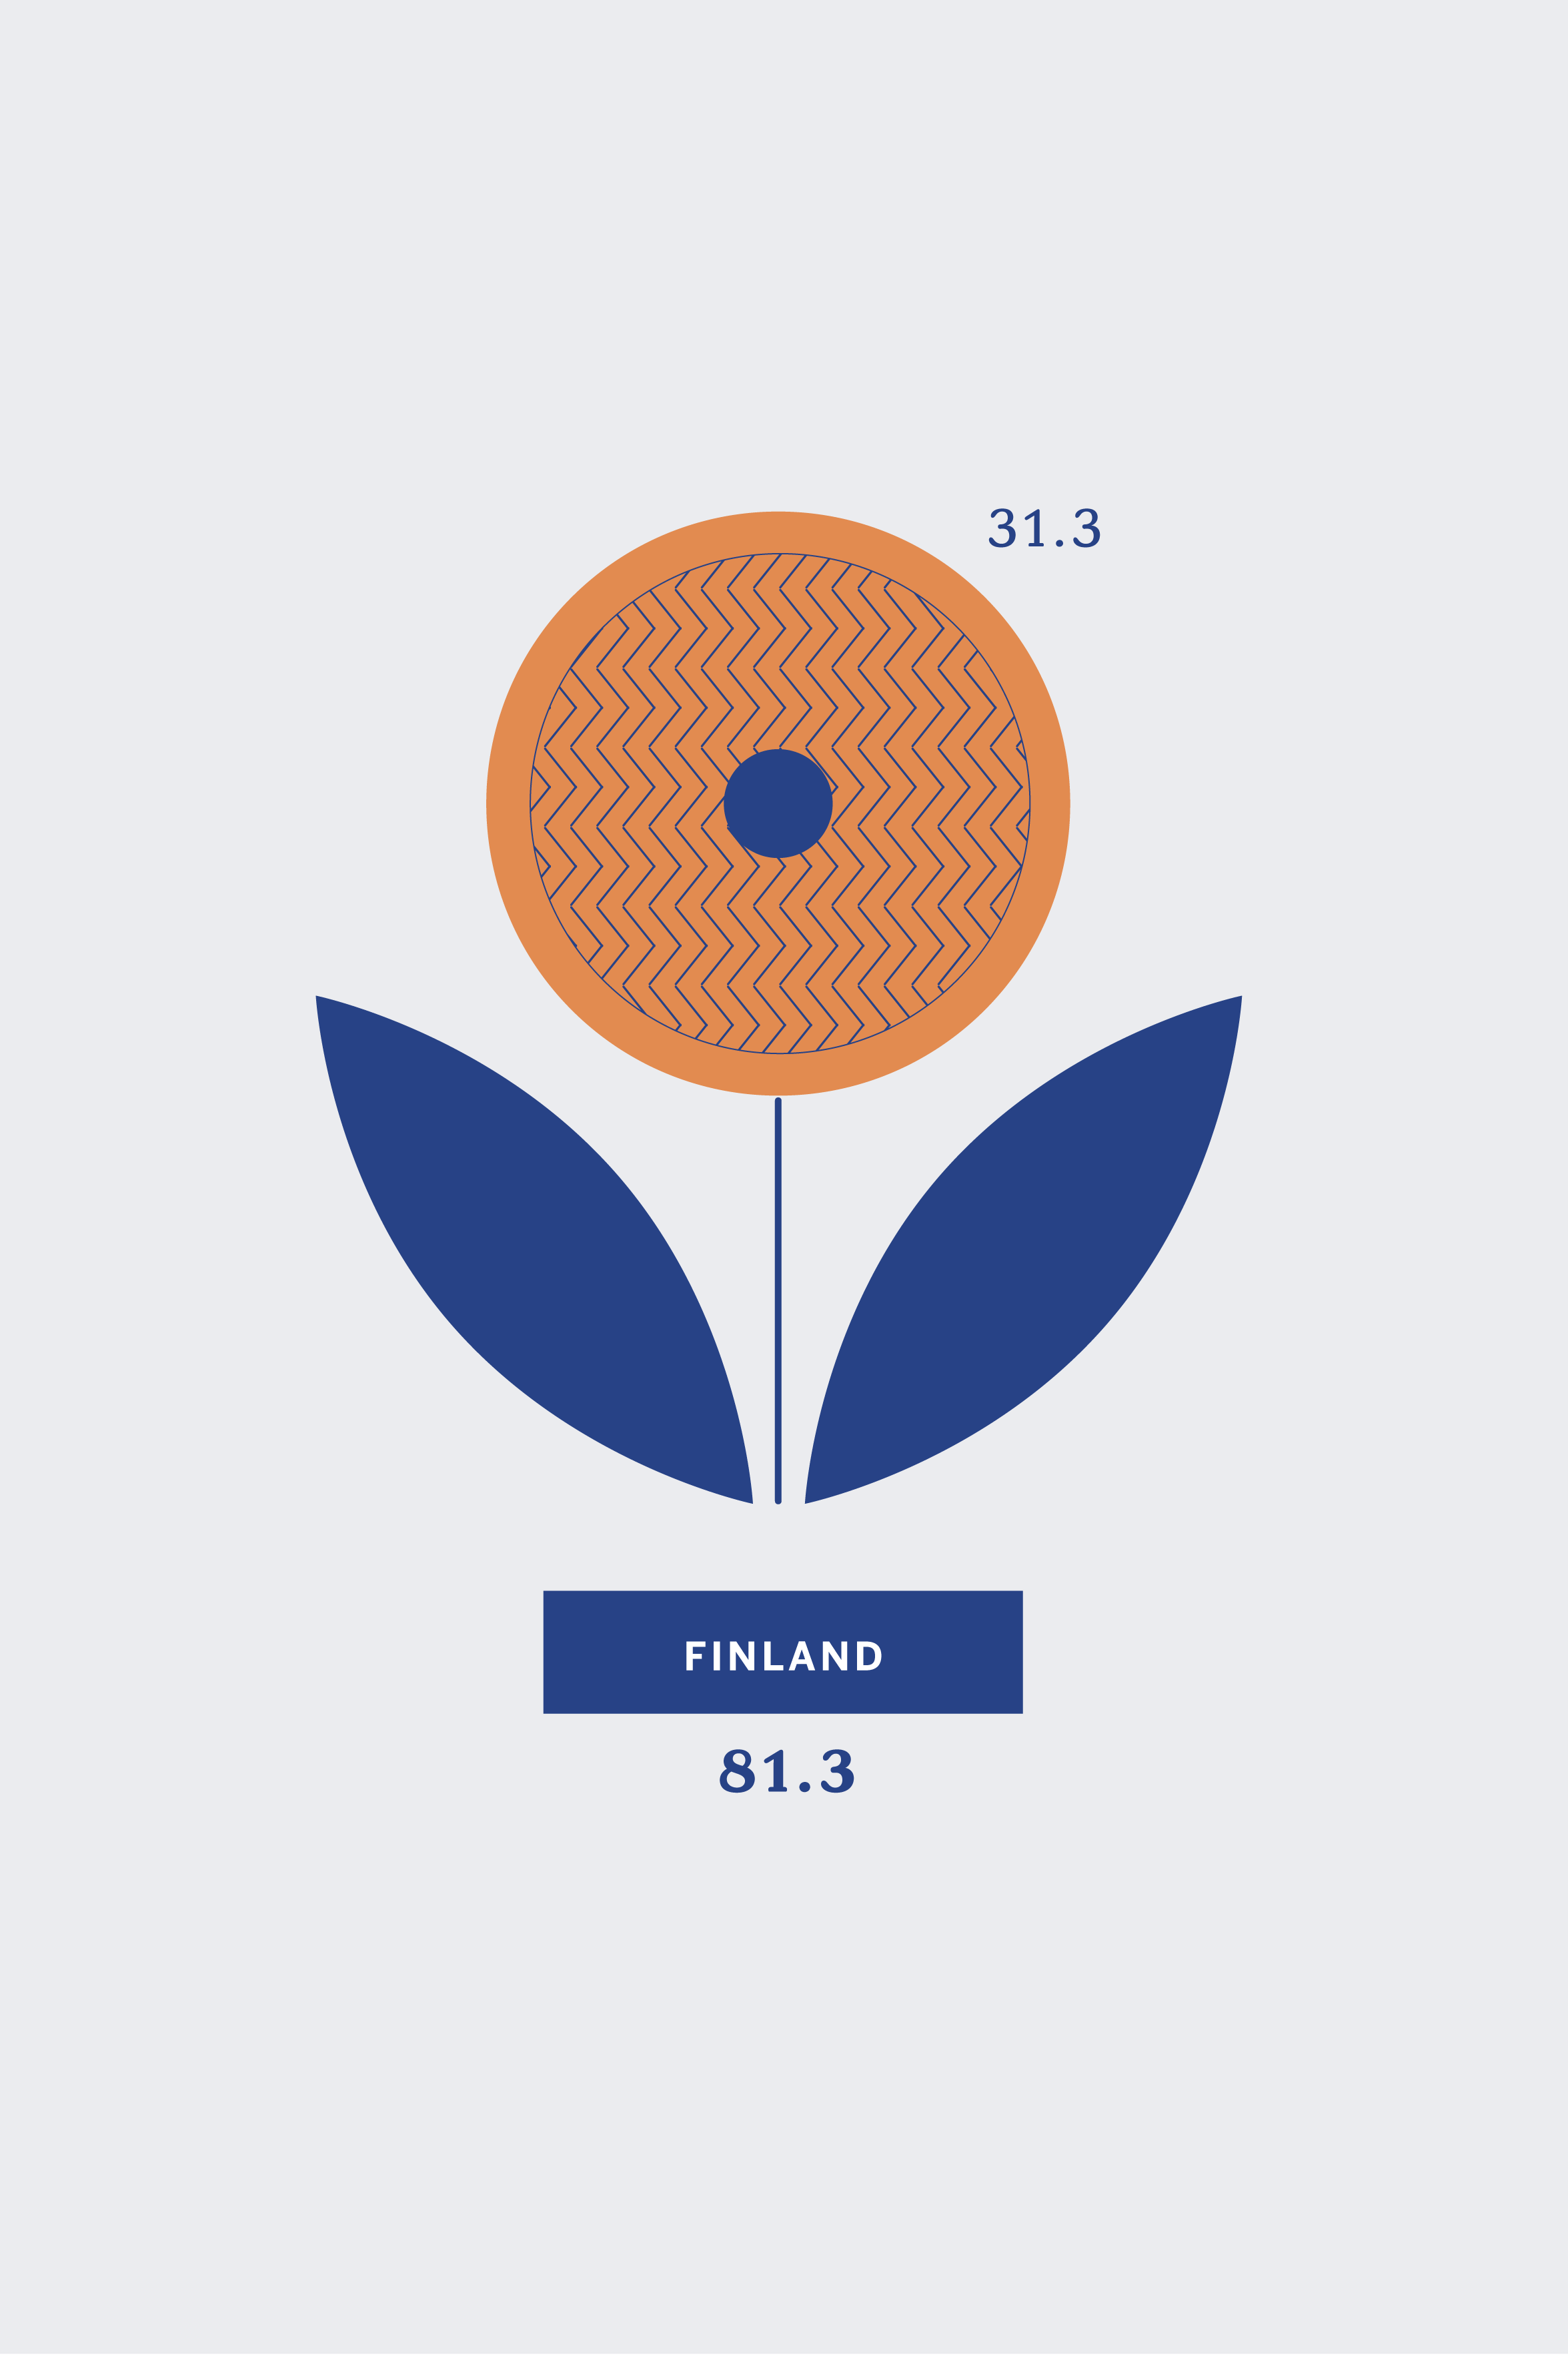
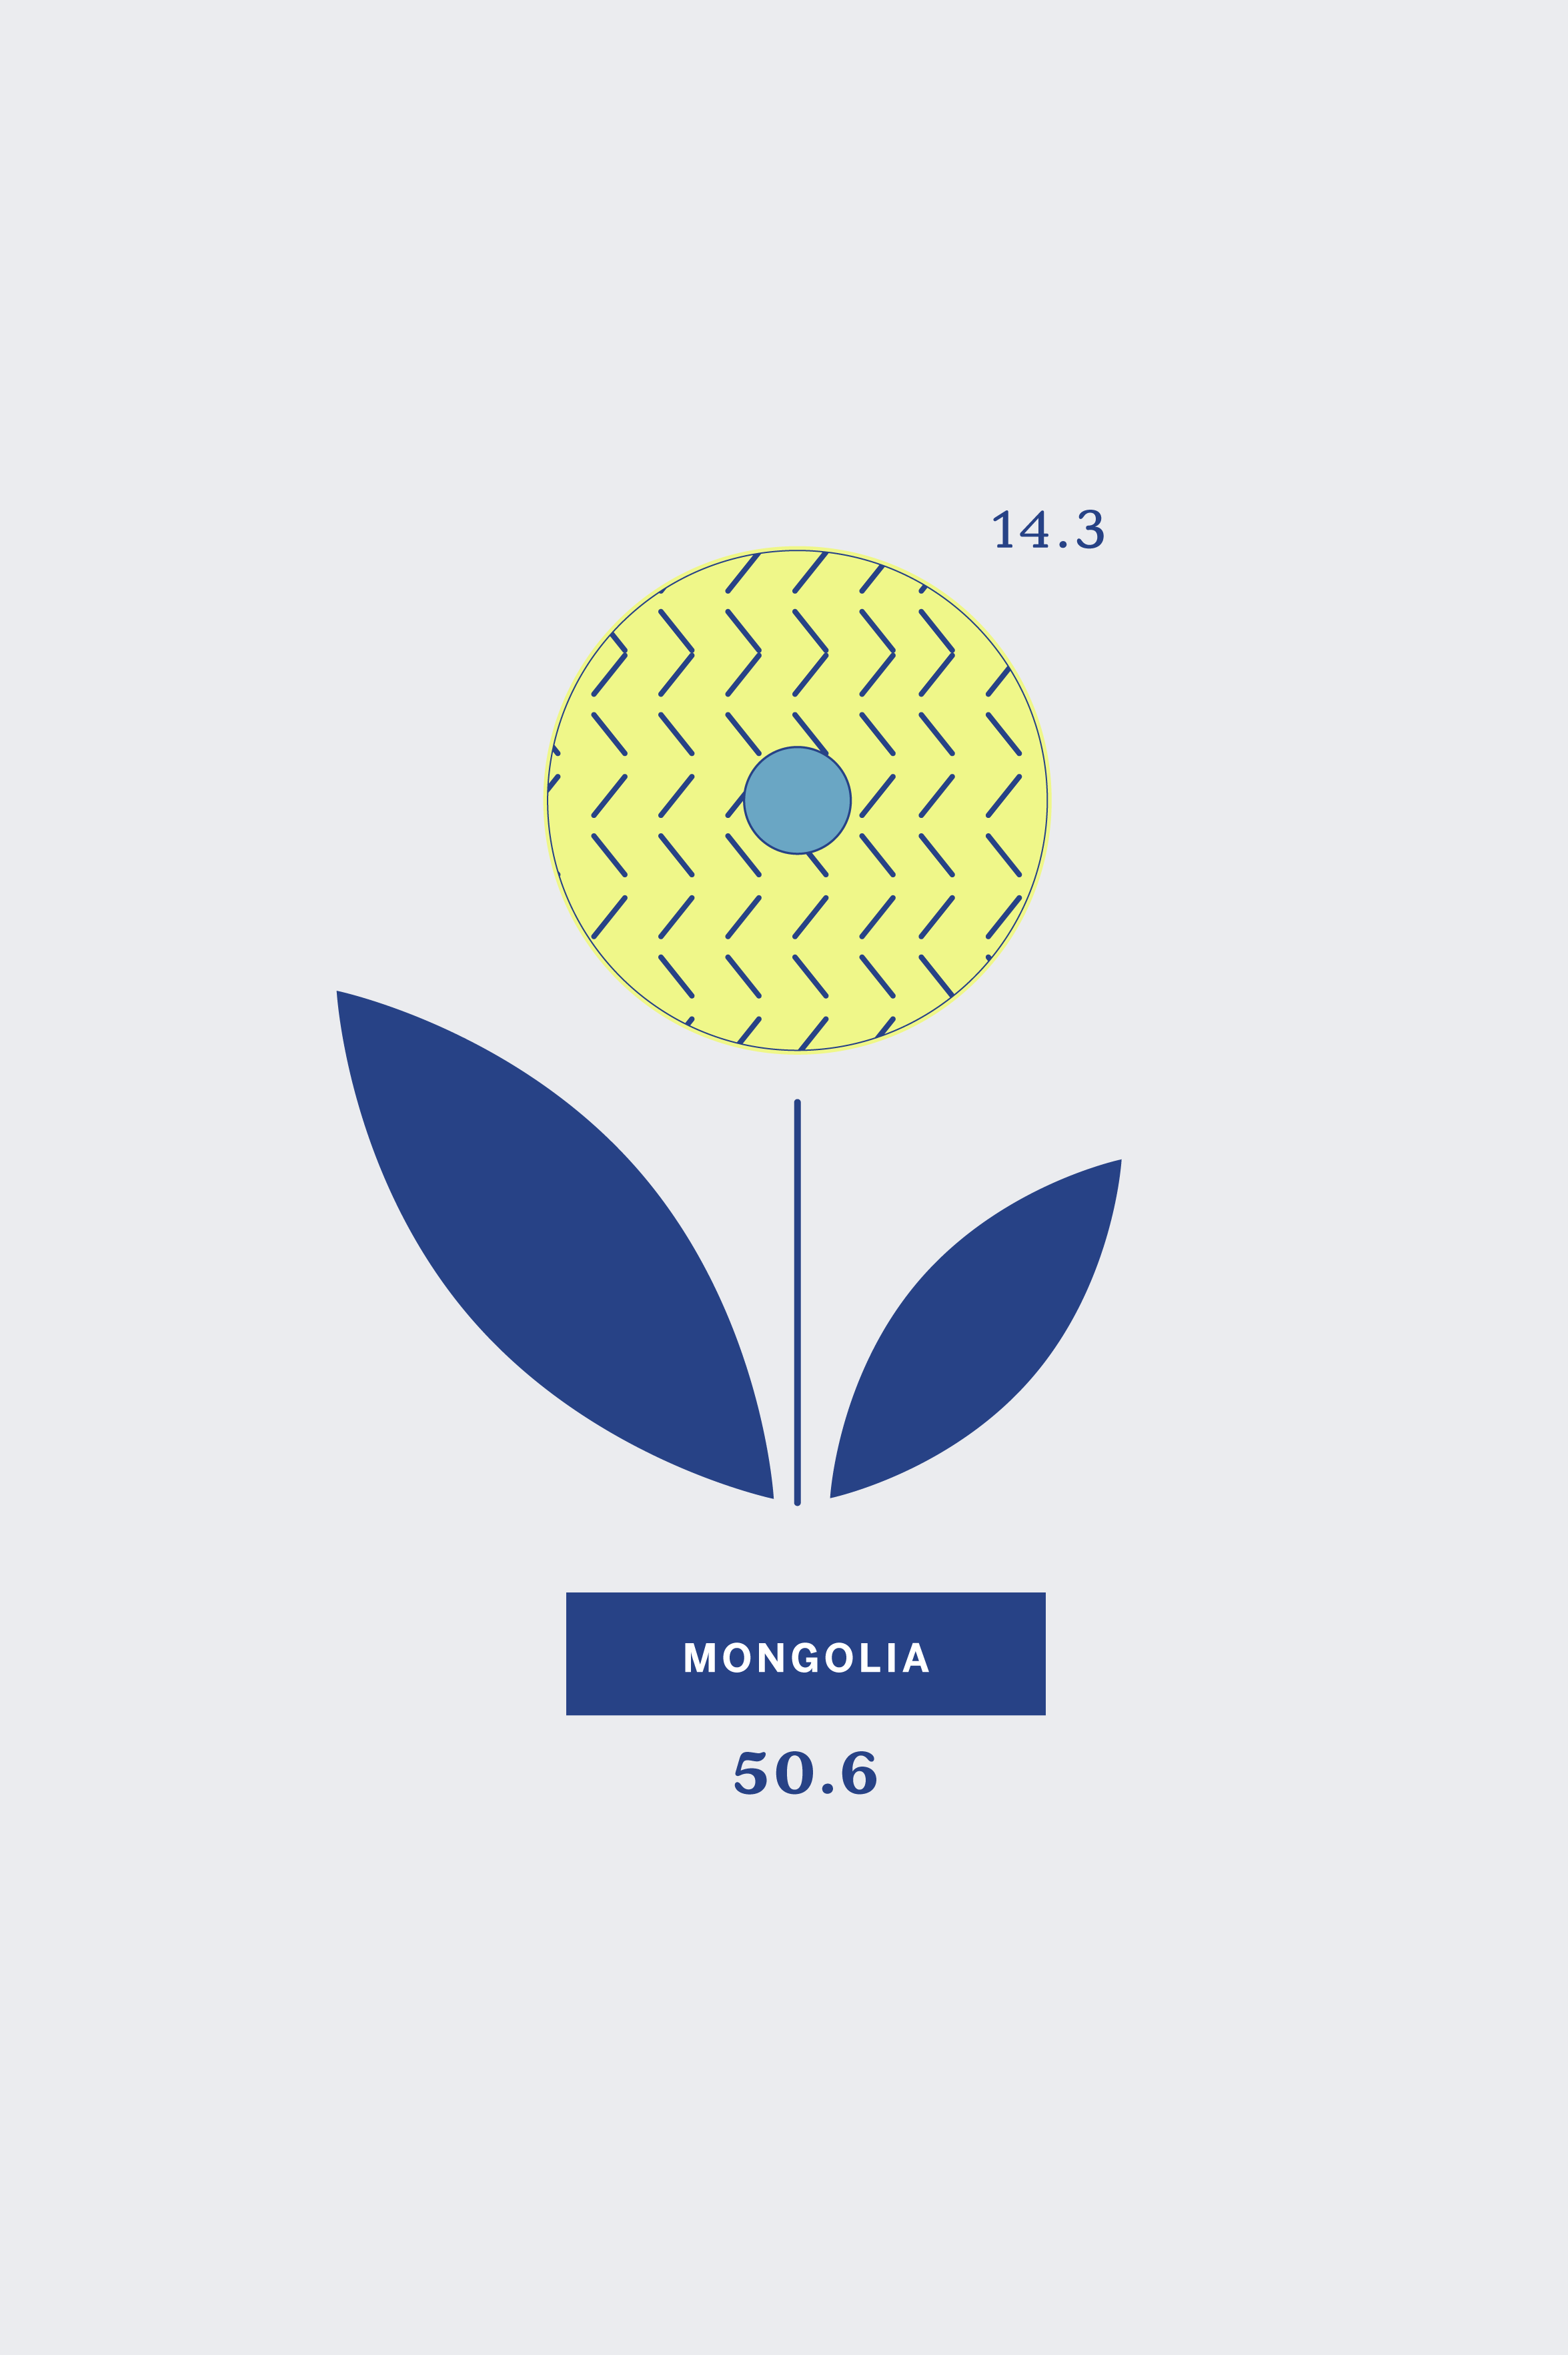
What was provided as a basic spreadsheet of numbers became a colourful and highly visual field of flowers to get immersed in and explore. Each flower represents one of the world’s country and each one of its parts represents a data point. Sustainability is visualized as an overall ranking, a numerical score from the Sustainable Economic Development Assessment. Happiness is visualized at the core of the flower and in its large petal through size, colours and patterns. Together they visualize data from the Happy Planet Index, The World Happiness Report Score and the Human Development Index. Liberties are visualized in the leaves, the Political Rights Score on the right, the Civil Liberties Score on the left.
Compiling all this data in a simple shape allows to easily compare, contrast and correlate. With the help of a legend the vast amount of data is easily digestible.
Seeing pattern emerge in the small multiple
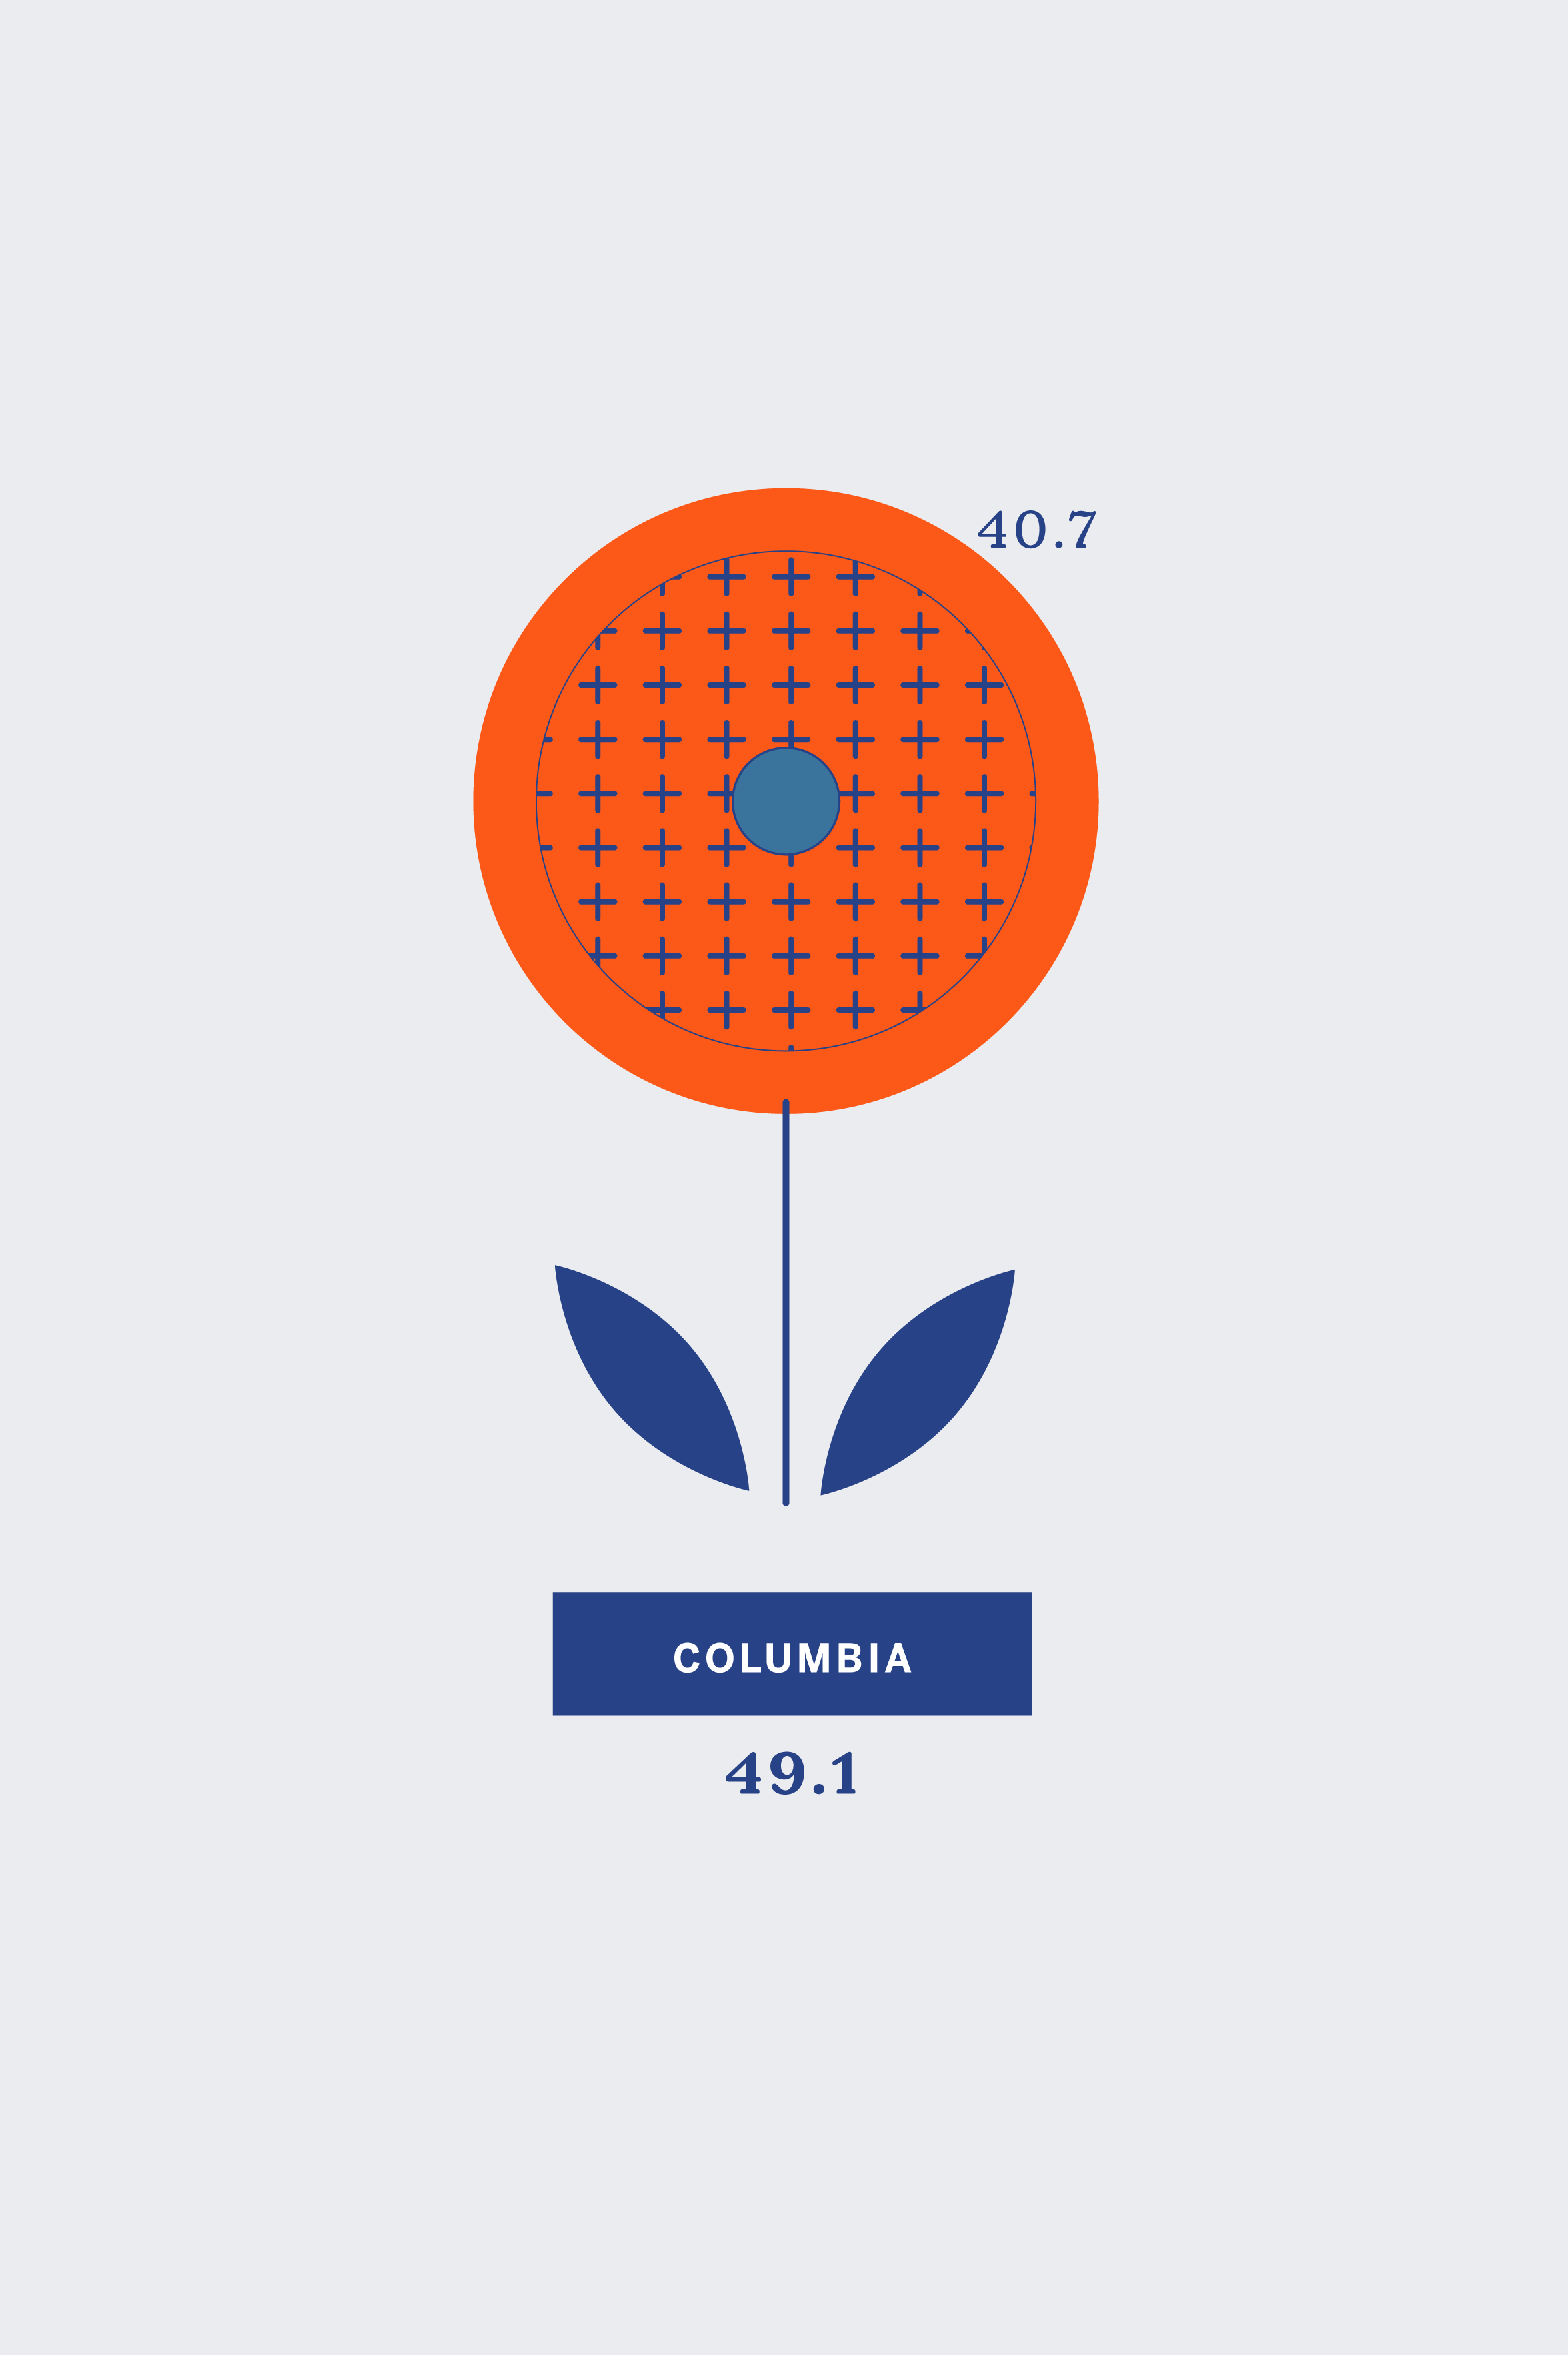
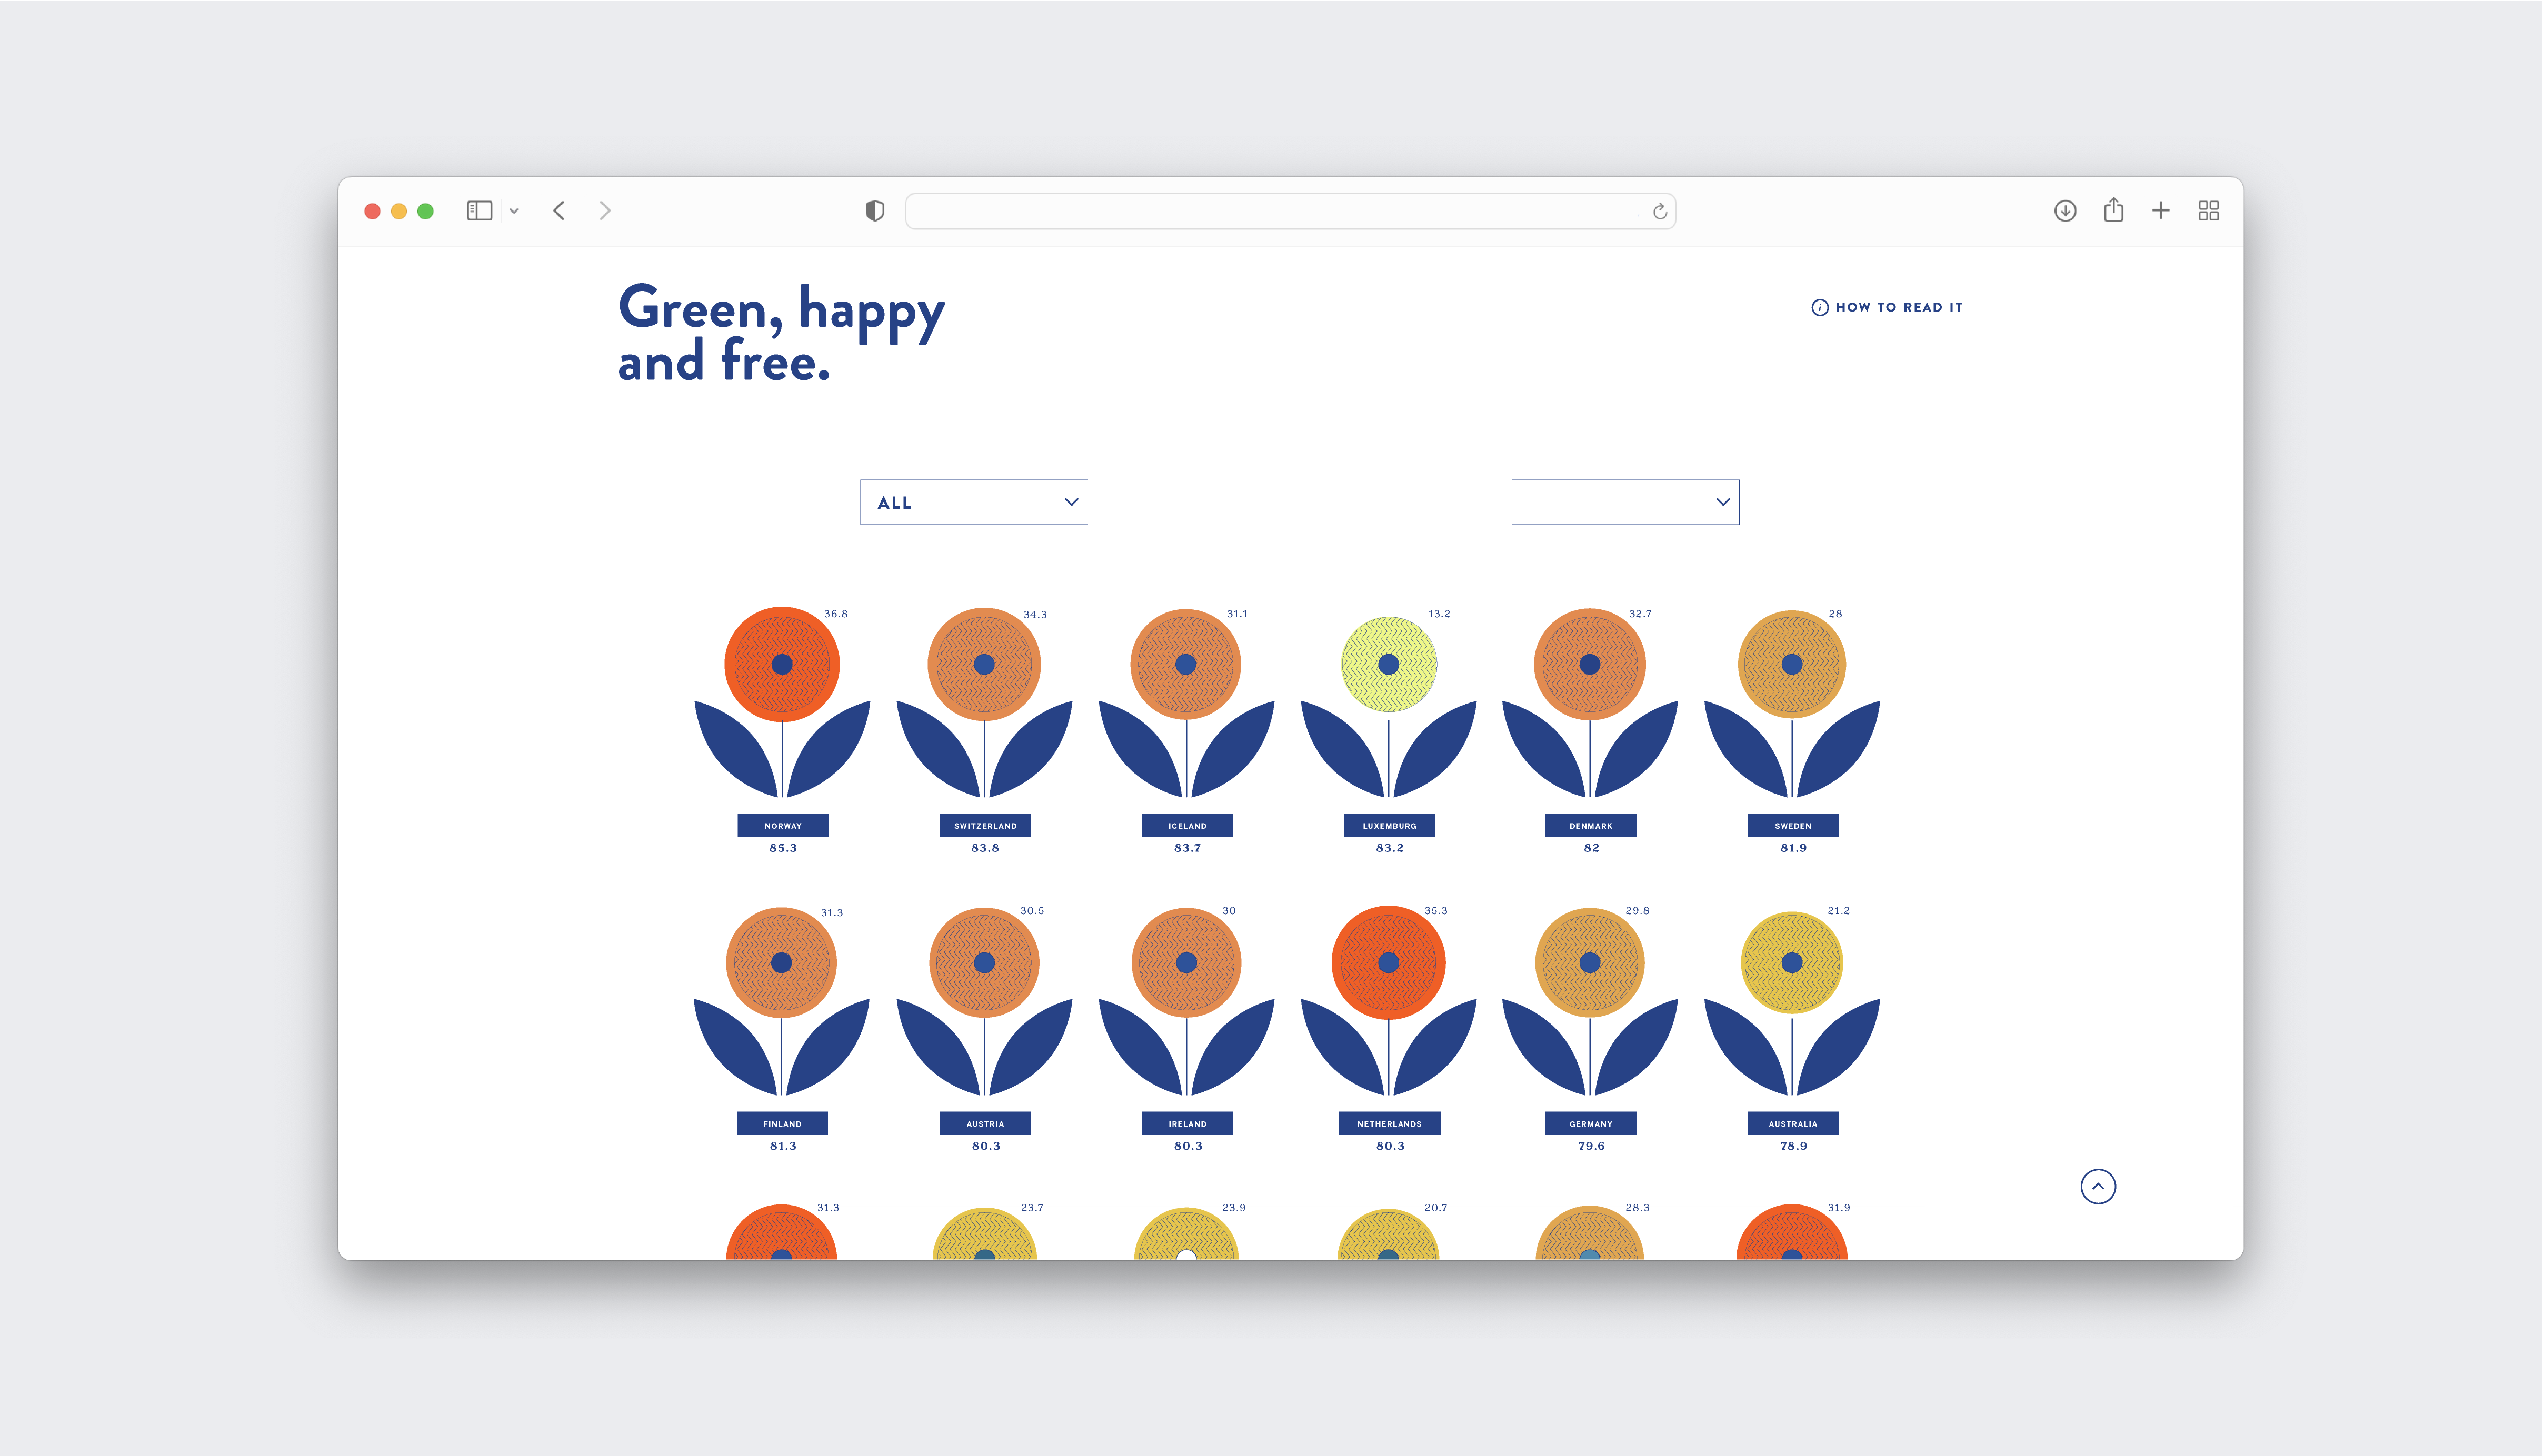
The countries, or flowers, are by default ranked by their score in sustainable development. Their arrangement in a grid makes comparing the entirety of the data easier. The user can simply scroll through and see patterns emerge in the variations: colours are getting paler, leaves are varying in sizes, a petal suddenly stands out because smaller.
The findings are plentiful and so are the questions. What makes Norway so ahead of all other world regions? Why is Luxembourg ranking so low in the Happy Index but so high in all other categories? The assumption that a high score in liberties would be determining the perceived happiness is debunked in countries like Mexico or Columbia. Bangladesh stands out from its neighbours in its ranking with a low score across all criteria but a high one in the Happy Planet Index. It goes on.
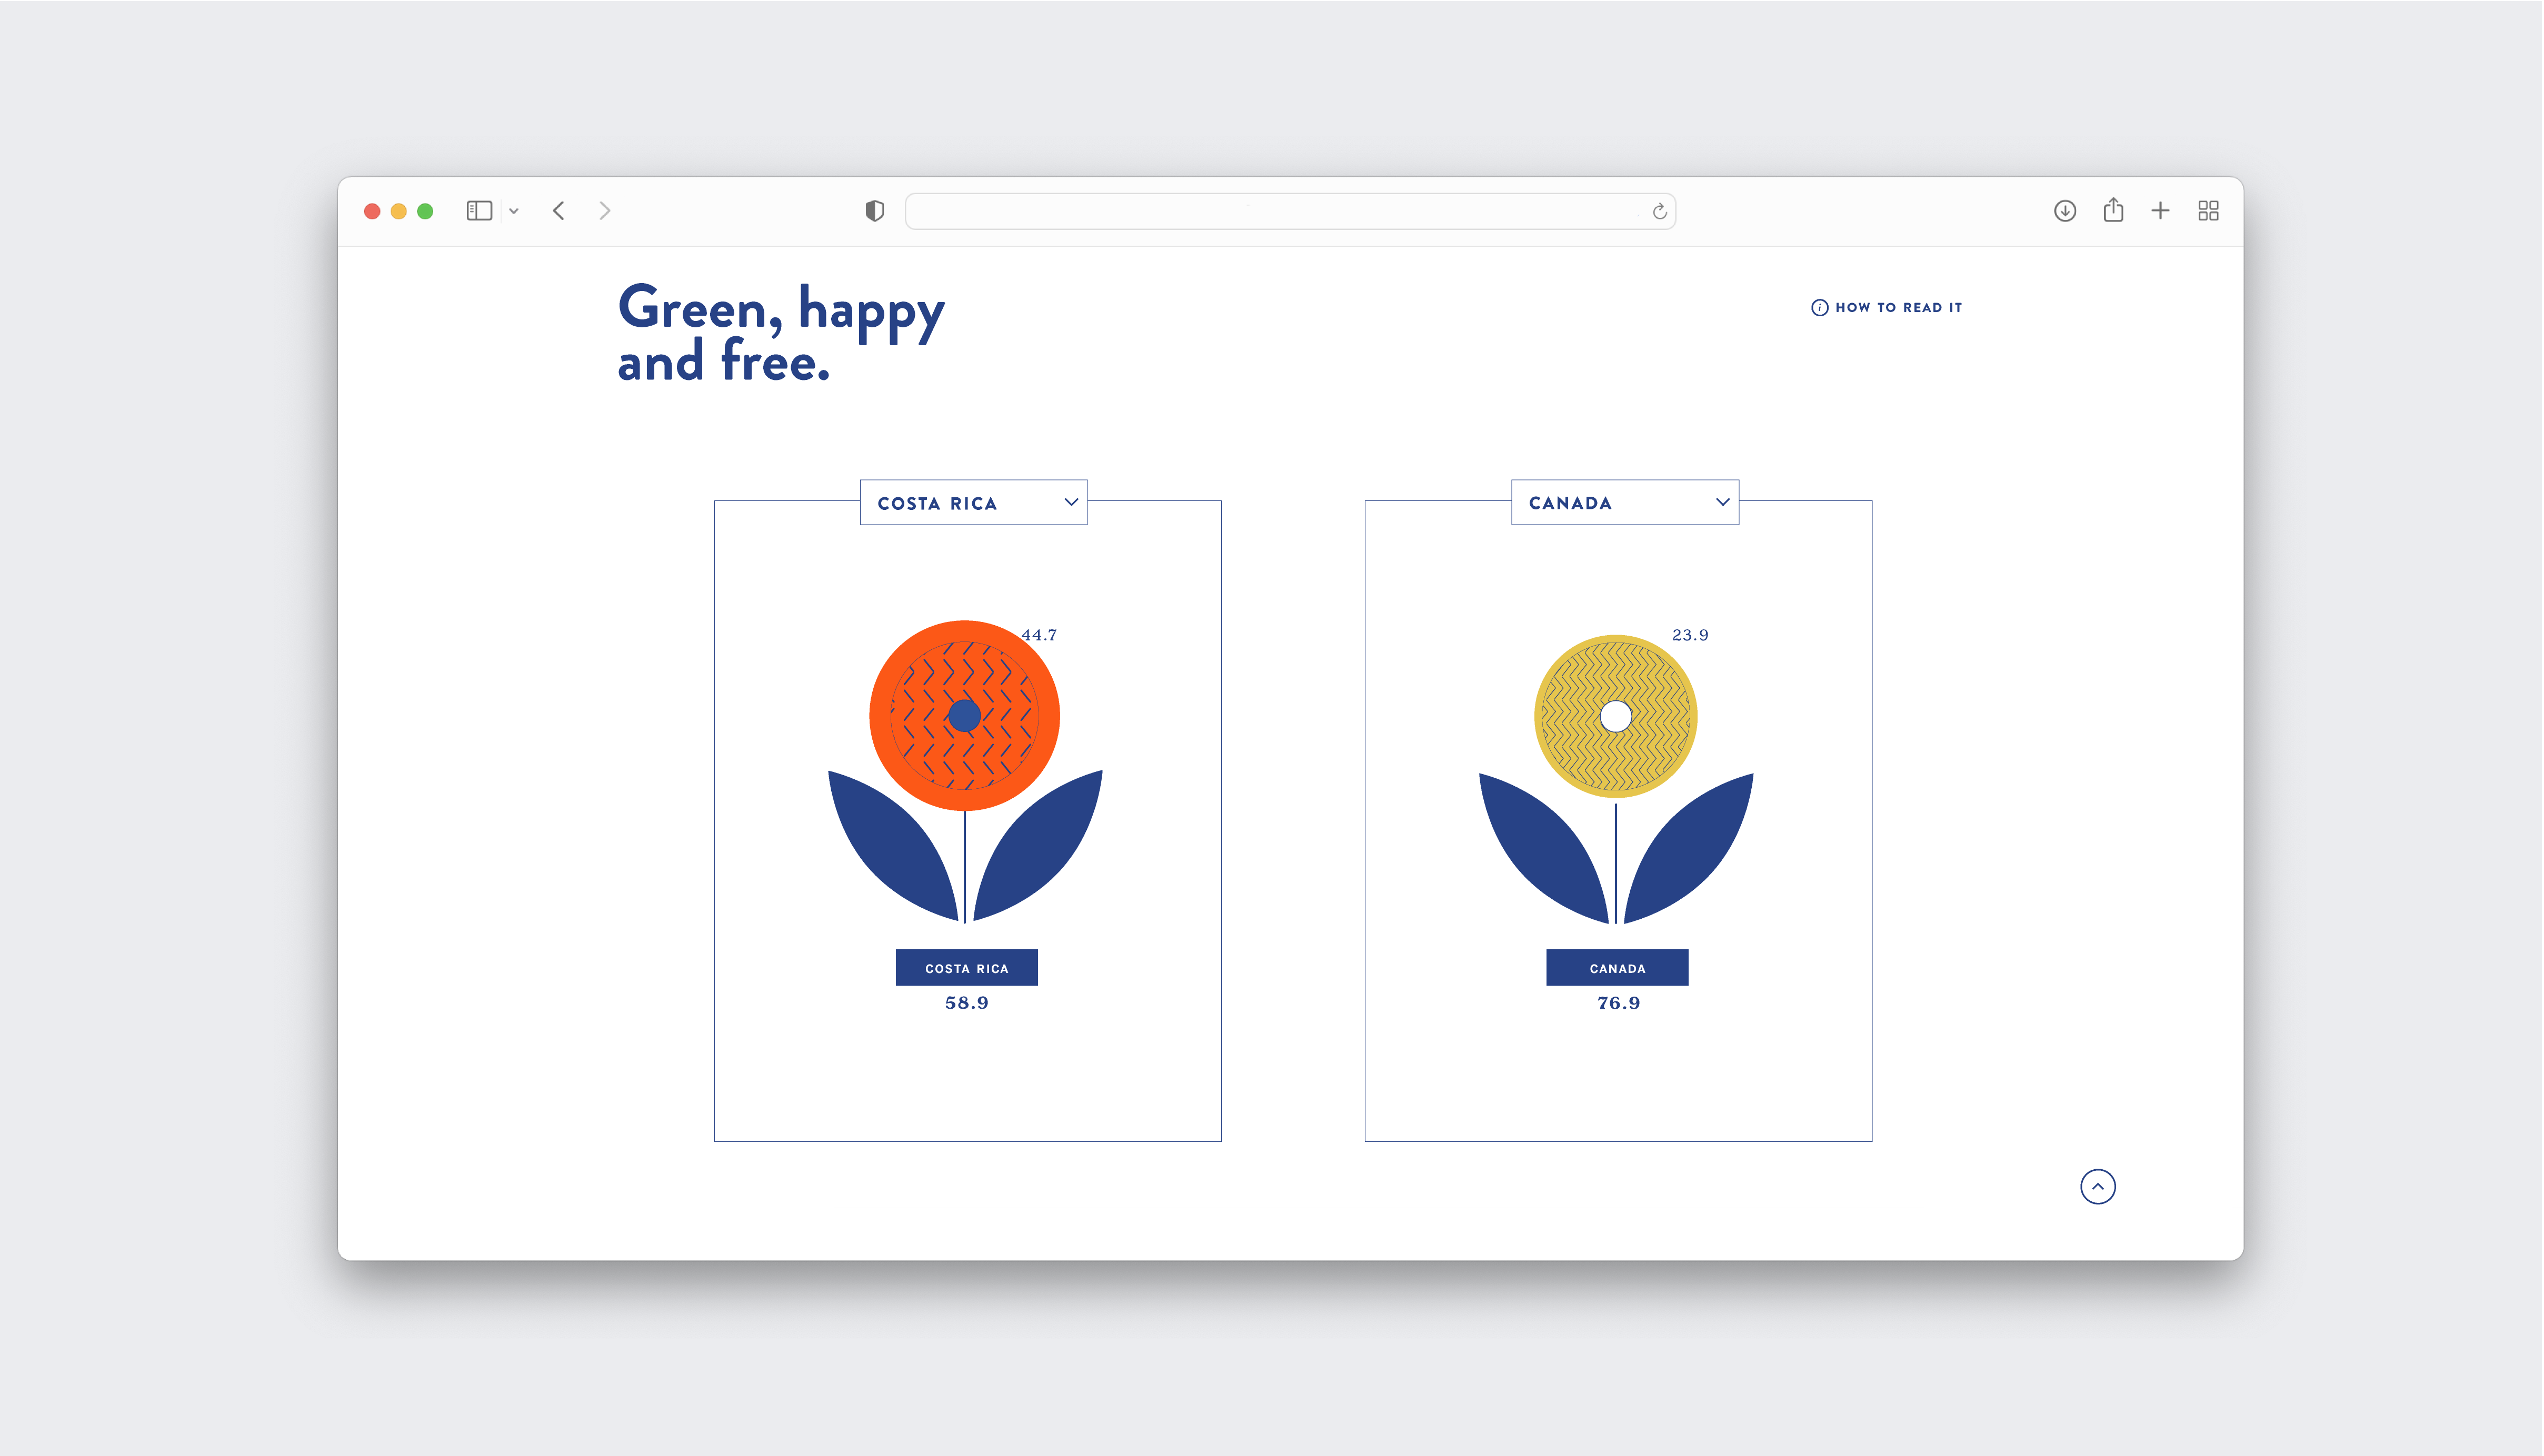
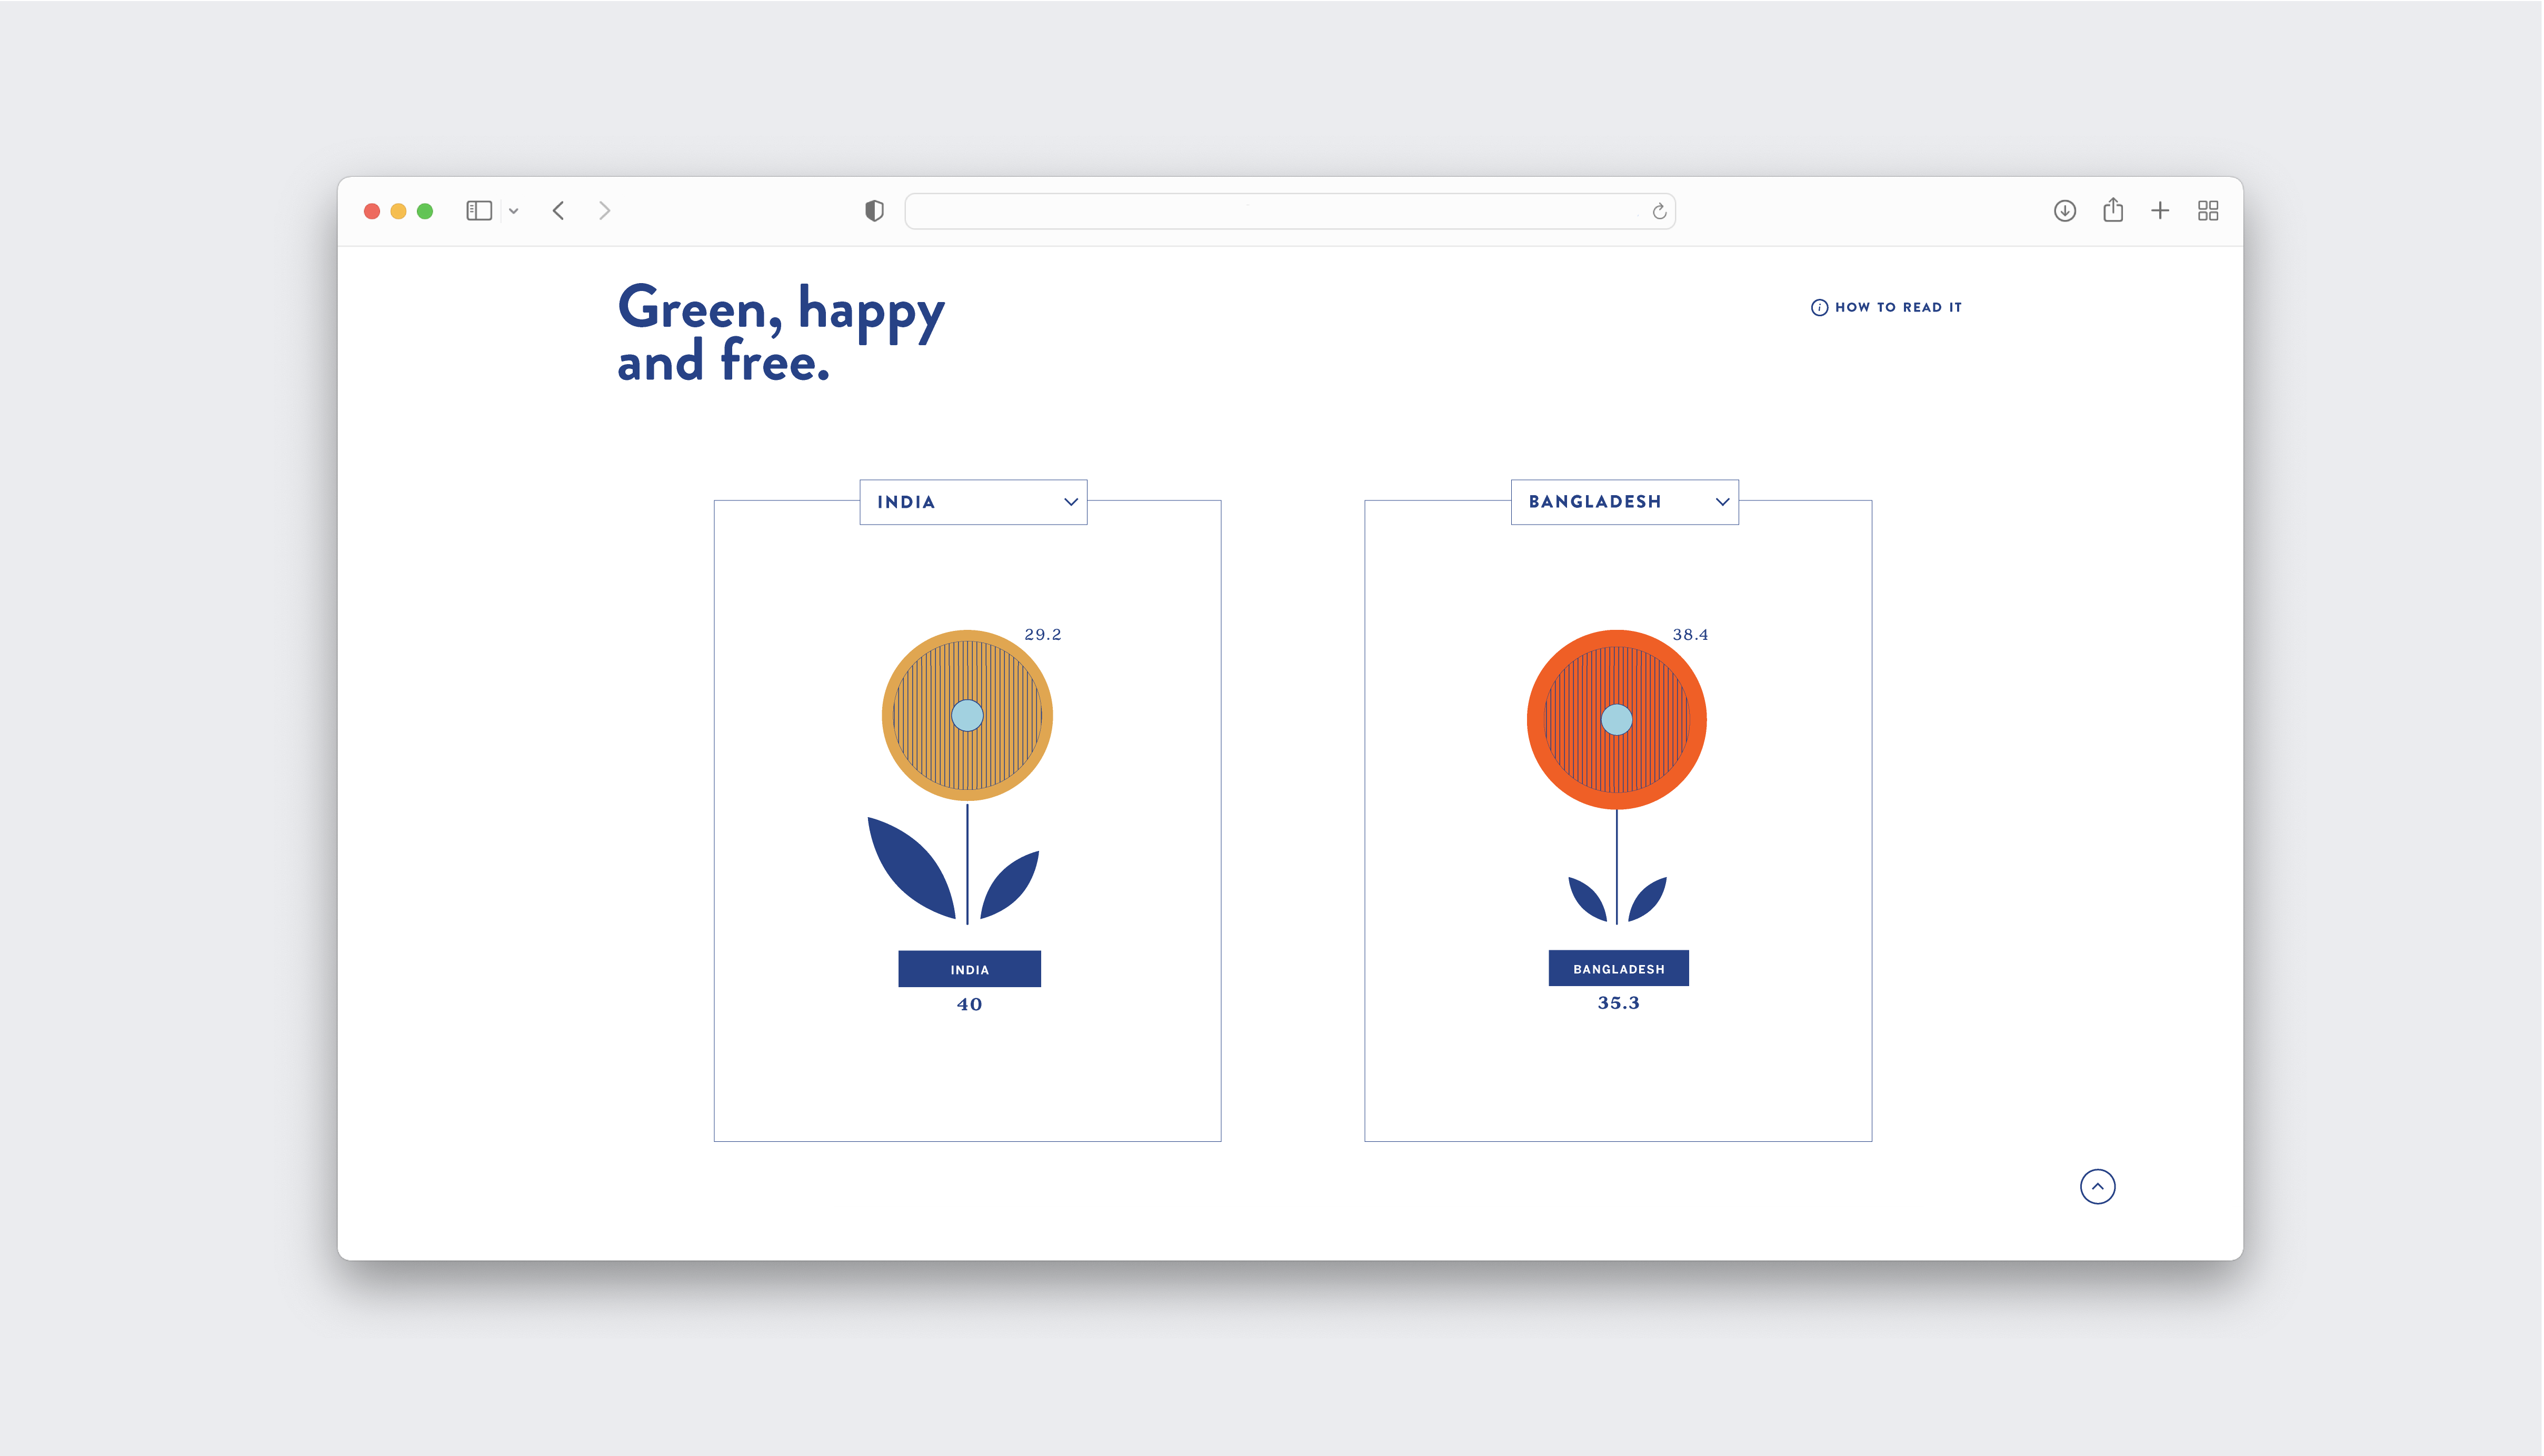
A basic interface to support specific comparisons
To dive in further and allow a comparison of specific countries, a simple interface allows to select countries to be displayed side by side. The user simply selects the desired countries to display in a menu that is otherwise set to ‘all’.